By MRA-UK: I try to keep a lid on my anger.
 Sometimes I fail.
Which is more important as a driver of inequality in educational attainment: sex or geographical location in the country?
Yesterday, 26/3/18, the press was full of a new report from the Children’s Commissioner of England, Anne Longfield, titled “Growing Up North – Look North: A generation of children await the powerhouse promise”. Based on 12 months of research and conversations with children, schools, businesses, councils, health professionals and charities, the main theme of the report was the educational divide between north and south. At all levels, primary, secondary and university entry, those in the “north” are trailing behind, the report tells us. Even if we compare similar socioeconomic groups, there is still a large regional gap. For example, a child on free school meals (FSM) living in London is twice as likely to go to university as a child on FSM from the north.
So far, so good. This is true, and it is entirely valid to bring attention to the fact – although I would quibble with the emphasis on the north/south split. In truth it is closer to being a London-versus-everywhere-else split, as we shall see.
So what’s my beef?
It’s the usual thing: the report completely ignores the fact that the gender gap in educational attainment is as bad – and arguably far worse – than the regional gap in attainment, serious though that also is.
Distressingly, this neglect appears to be deliberate.
If I have found the data, analysed it and written this blog article in one day, how credible is it that a whole body of funded professionals have failed to spot it in a year of study? Probability zero, I suggest. Ergo – deliberate.
Allow me to regale you with some data (when did I not?).
Key Stage 2 SATS
KS2 SATS provide a convenient measure of educational attainment towards the end of primary school, at age 10 or 11. Data for the 2016 SATS in England were used, from here,
SFR39/2016: National curriculum assessments at key stage 2, 2016 (provisional)
Results refer to “attaining the required standard” or to “achieving a higher standard”. SATS deploy both tests and teacher assessments, so there are a variety of results available. Results are expressed as a percentage of the cohort of the relevant sex attaining the stated level. Here we are less interested in the absolute attainment as in, (a) the attainment gap between the regions and London, and, (b) the gender gap in attainment.
The average regional gap, defined as the attainment in London minus the average attainment in England, is positive (i.e., London does better than the rest of the country).
Table 1 presents the average regional attainment gap, based on a range of options. The gender gap, averaged over England, is also given for comparison. For reading and writing, the gender gap is substantially bigger than the regional gap. For maths, the regional gap is the larger. However, overall, averaging the data in Table 1, the gender gap is larger (6.7) than the regional gap (3.7).
Figure 1 displays the regional variation in the gender gap in reading and writing. The gender gap in English is large everywhere and can be up to 14%. The gender gap in maths is small.
Table 1: KS2 SATS Gender Gap Versus Regional Gap (All England). The Table relates to the percentage of candidates reaching the indicated attainment level in the stated subjects. The regional gap is the difference with respect to London; the gender gap is girls minus boys.
* For tests this is grammar, spelling and punctuation; (1) Reaching required standard based on tests; (2) Reaching higher standard based on tests; (3) Reaching required standard based on teacher assessment
Figure 1 (click to enlarge)

GCSE
GCSEs are a convenient measure of secondary school attainment at age 16. Here I concentrate on the 2017 results in English and Maths, since these are the core subjects. Data for state-funded schools in England were taken from,
https://www.gov.uk/government/statistics/revised-gcse-and-equivalent-results-in-england-2016-to-2017
Regional data and data broken down by individual subject can be found in files,
Main local authority tables: SFR01/2018 and,
Subject tables: SFR01/2018
Grades 4 and above are regarded as a “standard pass” whilst grades 5 and above are termed a “strong pass”. The regional variation in the percentage of candidates attaining a pass is illustrated by Figures 2 and 3 (for standard and strong passes respectively). These Figures relate to pupils gaining passes in both English and maths. These histograms plot the difference between the percentage of London candidates gaining passes in both subjects, and the percentage of candidates in the regional locations gaining passes in both subjects.
Everywhere does worse than London. The North-East is worst. In every location the regional penalty is greater for boys than for girls. The combination “boys” plus “regional disadvantage” is intersectional, you might say. Interesting, isn’t it, that the lobby who are so keen on intersectionality didn’t spot that.
But they surely must have done. They just don’t care.
Figure 4 shows the gender gap in attainment at GCSE, the percentage of female candidates gaining passes in both subjects exceeding the percentage of male candidates by between 5% and 9%. Over England as a whole the gender gap exceeds the regional gap, as shown in Table 2.
But even this is only a partial story because using a criterion based on passing both maths and English exams disguises the extent to which boys lag behind in English. The gender gap at GCSE in the individual subjects is shown in Table 3. In maths there is virtual parity. But in English, the percentage of female candidates gaining passes exceeded the percentage of male candidates by between 14% and 19%.
Hence, the girls’ lead over boys in English has increased between age 11 and age 16 – and it was already bad at 11.
The gender gap in English GCSE (Table 3) is 3 or 4 times greater than the average regional gap (Table 2).
As a result, many boys who subsequently choose to do A levels will pick subjects in which reading and writing is minimised. The choice of maths, physics and chemistry is, for many boys, a negative one – motivated by the desire to avoid the dreaded word – which has plagued them throughout their school career. In stark contrast (and, yes, I’m generalising) girls’ choice of other subjects is a positive one, since words hold no fear for them.
Figure 2 (click to enlarge)

Figure 3 (click to enlarge)

Figure 4 (click to enlarge)

Table 2: GCSE Gender Gap Versus Regional Gap (All England). The Table relates to the percentage of candidates gaining passes in both English and Maths. The regional gap is the country-average difference with respect to London; the gender gap is girls minus boys, averaged for England.
Table 3: GCSE Gender Gap by Individual Subject
University Entry
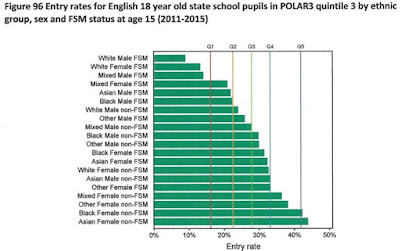
I won’t go into the details of university entrance data here. Figure 5 is all you really need. It was taken from the 2015 UCAS End of Cycle Report (Page 130). The histogram gives the percentage of the population of that demographic who started at university that year. Twenty demographic classes are used in Figure 5, representing various combinations of sex, race and socioeconomic class. The latter is gauged by the receipt of free school meals (FSM).
Growing Up North tells us that “a FSM child living in London is twice as likely to go to university as a FSM child from the north”.
But Figure 5 tells us that a FSM black woman is three times more likely to go to university than an FSM white boy.
Eight of the top nine demographics in Figure 5 are female.
The lowest ranked non-FSM demographic are white males at 14th position.
Poor (FSM) white males are bottom of the list of 20 – though FSM white females are second to the bottom.
Figure 5 (click to enlarge)
Growing Up North
The sub-title of the Children’s Commissioner’s report is “Look North: A generation of children await the powerhouse promise”. The political context of the ‘northern powerhouse’ has a bearing on the slant of the report. Doing a word search for “boys” gives 6 hits. These are they…
Having been asked if they expected their local area to improve in the next five years, we were told “generally boys were more optimistic than girls”.
In describing the focus groups held by the authors, we were told that they “held separate sessions with boys and girls”.
In the context of being asked about career aspirations, it was reported that, “boys were generally much more optimistic about the opportunities open to them locally” and it was surmised that this “may be a reflection of the fact that men earn much more than women in all the areas we visited”.
“Differences between boys and girls: Throughout our work we encountered significant differences between boys and girls, both in terms of their career aspirations and what they believed their local area offered them. Within the context of regeneration we think this is important. We know girls outperform boys throughout school but are paid less as adults. This is a particular issue in many Northern areas where traditional industries have been very male-dominated. It is very important that regeneration strategies tackle this and speak to girls’ aspirations, particularly if the regeneration is focused on industries which are perceived as male.”
There are no other mentions of boys. Specifically, boys’ huge educational attainment shortfalls go unmentioned in a report which is primarily about educational attainment gaps.
Let that sink in.
But worse: the above remarks – the only mention of boys in the report – appear to be attempts to deflect attention away from boys – because they will earn more, don’t you know. It is not the first time the “gender pay gap” (so-called) has been used to provide spurious justification of the huge education gender gap.
I confess, I already had a bit of a beef with the Children’s Commissioner, Anne Longfield. In her 2017/18 Business Plan she reported that she, together with Dame Louise Casey, had visited 10 of the children in the secure estate “to learn about their lives before entering custody and understand the factors that led to them being imprisoned and what, if anything, could have been done to change their trajectory”. Very laudable. I thoroughly approve. It’s exactly what a Children’s Commissioner should do. Just one problem. Yes, the usual one.
As of January 2018 there are 878 under 18s in custody, of which 847 are boys and just 31 are girls, i.e., 96.5% are boys and 3.5% girls. You guessed the punchline. Anne Longfield and Dame Louise Casey chose to visit 10 girls, and only girls. (This is their report).
It’s apposite to quote again my all-time favourite feminist quote, from the 2007 Corston Report – which is particularly appropriate since it’s subject matter is women in prison – “equality does not mean treating everyone the same”. Not in some people’s opinion, anyway.
The title of this blog is The Illustrated Empathy Gap. What better illustration of the empathy gap do you want?
Conclusions
There is a strong regional variation in KS2 SATS and GCSE attainment, to the advantage of London and the disadvantage of everywhere else.
The regional penalty is greater for boys than girls.
Boys do far worse than girls in English, but are comparable in maths. Based on combined English and maths, the gender gap averaged over the whole of England is greater than the regional penalty averaged over the whole of England.
In GCSE English, the gender gap is far worse than the regional attainment gap – 3 or 4 times greater based on averages over England.
The gender gap in educational attainment is therefore more significant than the regional attainment gap. But the Children’s Commissioner’s report, Growing Up North, ignores the gender gap.
The implication of the report is that male educational disadvantage does not matter.

Source
 Sometimes I fail.
Which is more important as a driver of inequality in educational attainment: sex or geographical location in the country?
Yesterday, 26/3/18, the press was full of a new report from the Children’s Commissioner of England, Anne Longfield, titled “Growing Up North – Look North: A generation of children await the powerhouse promise”. Based on 12 months of research and conversations with children, schools, businesses, councils, health professionals and charities, the main theme of the report was the educational divide between north and south. At all levels, primary, secondary and university entry, those in the “north” are trailing behind, the report tells us. Even if we compare similar socioeconomic groups, there is still a large regional gap. For example, a child on free school meals (FSM) living in London is twice as likely to go to university as a child on FSM from the north.
So far, so good. This is true, and it is entirely valid to bring attention to the fact – although I would quibble with the emphasis on the north/south split. In truth it is closer to being a London-versus-everywhere-else split, as we shall see.
So what’s my beef?
It’s the usual thing: the report completely ignores the fact that the gender gap in educational attainment is as bad – and arguably far worse – than the regional gap in attainment, serious though that also is.
Distressingly, this neglect appears to be deliberate.
If I have found the data, analysed it and written this blog article in one day, how credible is it that a whole body of funded professionals have failed to spot it in a year of study? Probability zero, I suggest. Ergo – deliberate.
Allow me to regale you with some data (when did I not?).
Key Stage 2 SATS
KS2 SATS provide a convenient measure of educational attainment towards the end of primary school, at age 10 or 11. Data for the 2016 SATS in England were used, from here,
SFR39/2016: National curriculum assessments at key stage 2, 2016 (provisional)
Results refer to “attaining the required standard” or to “achieving a higher standard”. SATS deploy both tests and teacher assessments, so there are a variety of results available. Results are expressed as a percentage of the cohort of the relevant sex attaining the stated level. Here we are less interested in the absolute attainment as in, (a) the attainment gap between the regions and London, and, (b) the gender gap in attainment.
The average regional gap, defined as the attainment in London minus the average attainment in England, is positive (i.e., London does better than the rest of the country).
Table 1 presents the average regional attainment gap, based on a range of options. The gender gap, averaged over England, is also given for comparison. For reading and writing, the gender gap is substantially bigger than the regional gap. For maths, the regional gap is the larger. However, overall, averaging the data in Table 1, the gender gap is larger (6.7) than the regional gap (3.7).
Figure 1 displays the regional variation in the gender gap in reading and writing. The gender gap in English is large everywhere and can be up to 14%. The gender gap in maths is small.
Table 1: KS2 SATS Gender Gap Versus Regional Gap (All England). The Table relates to the percentage of candidates reaching the indicated attainment level in the stated subjects. The regional gap is the difference with respect to London; the gender gap is girls minus boys.
| Item | Reading | Writing* | Mathematics |
| Regional gap, girls (1) | 2 | 4 | 6 |
| Regional gap, boys (1) | 3 | 6 | 5 |
| Regional gap, girls (2) | 1 | 6 | 5 |
| Regional gap, boys (2) | 2 | 7 | 6 |
| Regional gap, girls (3) | 0 | 2 | 3 |
| Regional gap, boys (3) | 2 | 4 | 2 |
| Gender gap, tests | 7 | 10 | 0 |
| Gender gap, teachers’ assessment | 9 | 12 | 2 |
Figure 1 (click to enlarge)

GCSE
GCSEs are a convenient measure of secondary school attainment at age 16. Here I concentrate on the 2017 results in English and Maths, since these are the core subjects. Data for state-funded schools in England were taken from,
https://www.gov.uk/government/statistics/revised-gcse-and-equivalent-results-in-england-2016-to-2017
Regional data and data broken down by individual subject can be found in files,
Main local authority tables: SFR01/2018 and,
Subject tables: SFR01/2018
Grades 4 and above are regarded as a “standard pass” whilst grades 5 and above are termed a “strong pass”. The regional variation in the percentage of candidates attaining a pass is illustrated by Figures 2 and 3 (for standard and strong passes respectively). These Figures relate to pupils gaining passes in both English and maths. These histograms plot the difference between the percentage of London candidates gaining passes in both subjects, and the percentage of candidates in the regional locations gaining passes in both subjects.
Everywhere does worse than London. The North-East is worst. In every location the regional penalty is greater for boys than for girls. The combination “boys” plus “regional disadvantage” is intersectional, you might say. Interesting, isn’t it, that the lobby who are so keen on intersectionality didn’t spot that.
But they surely must have done. They just don’t care.
Figure 4 shows the gender gap in attainment at GCSE, the percentage of female candidates gaining passes in both subjects exceeding the percentage of male candidates by between 5% and 9%. Over England as a whole the gender gap exceeds the regional gap, as shown in Table 2.
But even this is only a partial story because using a criterion based on passing both maths and English exams disguises the extent to which boys lag behind in English. The gender gap at GCSE in the individual subjects is shown in Table 3. In maths there is virtual parity. But in English, the percentage of female candidates gaining passes exceeded the percentage of male candidates by between 14% and 19%.
Hence, the girls’ lead over boys in English has increased between age 11 and age 16 – and it was already bad at 11.
The gender gap in English GCSE (Table 3) is 3 or 4 times greater than the average regional gap (Table 2).
As a result, many boys who subsequently choose to do A levels will pick subjects in which reading and writing is minimised. The choice of maths, physics and chemistry is, for many boys, a negative one – motivated by the desire to avoid the dreaded word – which has plagued them throughout their school career. In stark contrast (and, yes, I’m generalising) girls’ choice of other subjects is a positive one, since words hold no fear for them.
Figure 2 (click to enlarge)

Figure 3 (click to enlarge)

Figure 4 (click to enlarge)

Table 2: GCSE Gender Gap Versus Regional Gap (All England). The Table relates to the percentage of candidates gaining passes in both English and Maths. The regional gap is the country-average difference with respect to London; the gender gap is girls minus boys, averaged for England.
| Item | Grades 5 to 9 | Grades 4 to 9 |
| Regional gap, girls | 4.9% | 2.9% |
| Regional gap, boys | 5.7% | 4.6% |
| Gender gap | 6.0% | 7.3% |
| Subject | Grades 5 to 9 | Grades 4 to 9 |
| English language | 19% | 16% |
| English literature | 17% | 14% |
| Mathematics | 0% | 1% |
I won’t go into the details of university entrance data here. Figure 5 is all you really need. It was taken from the 2015 UCAS End of Cycle Report (Page 130). The histogram gives the percentage of the population of that demographic who started at university that year. Twenty demographic classes are used in Figure 5, representing various combinations of sex, race and socioeconomic class. The latter is gauged by the receipt of free school meals (FSM).
Growing Up North tells us that “a FSM child living in London is twice as likely to go to university as a FSM child from the north”.
But Figure 5 tells us that a FSM black woman is three times more likely to go to university than an FSM white boy.
Eight of the top nine demographics in Figure 5 are female.
The lowest ranked non-FSM demographic are white males at 14th position.
Poor (FSM) white males are bottom of the list of 20 – though FSM white females are second to the bottom.
Figure 5 (click to enlarge)

Growing Up North
The sub-title of the Children’s Commissioner’s report is “Look North: A generation of children await the powerhouse promise”. The political context of the ‘northern powerhouse’ has a bearing on the slant of the report. Doing a word search for “boys” gives 6 hits. These are they…
Having been asked if they expected their local area to improve in the next five years, we were told “generally boys were more optimistic than girls”.
In describing the focus groups held by the authors, we were told that they “held separate sessions with boys and girls”.
In the context of being asked about career aspirations, it was reported that, “boys were generally much more optimistic about the opportunities open to them locally” and it was surmised that this “may be a reflection of the fact that men earn much more than women in all the areas we visited”.
“Differences between boys and girls: Throughout our work we encountered significant differences between boys and girls, both in terms of their career aspirations and what they believed their local area offered them. Within the context of regeneration we think this is important. We know girls outperform boys throughout school but are paid less as adults. This is a particular issue in many Northern areas where traditional industries have been very male-dominated. It is very important that regeneration strategies tackle this and speak to girls’ aspirations, particularly if the regeneration is focused on industries which are perceived as male.”
There are no other mentions of boys. Specifically, boys’ huge educational attainment shortfalls go unmentioned in a report which is primarily about educational attainment gaps.
Let that sink in.
But worse: the above remarks – the only mention of boys in the report – appear to be attempts to deflect attention away from boys – because they will earn more, don’t you know. It is not the first time the “gender pay gap” (so-called) has been used to provide spurious justification of the huge education gender gap.
I confess, I already had a bit of a beef with the Children’s Commissioner, Anne Longfield. In her 2017/18 Business Plan she reported that she, together with Dame Louise Casey, had visited 10 of the children in the secure estate “to learn about their lives before entering custody and understand the factors that led to them being imprisoned and what, if anything, could have been done to change their trajectory”. Very laudable. I thoroughly approve. It’s exactly what a Children’s Commissioner should do. Just one problem. Yes, the usual one.
As of January 2018 there are 878 under 18s in custody, of which 847 are boys and just 31 are girls, i.e., 96.5% are boys and 3.5% girls. You guessed the punchline. Anne Longfield and Dame Louise Casey chose to visit 10 girls, and only girls. (This is their report).
It’s apposite to quote again my all-time favourite feminist quote, from the 2007 Corston Report – which is particularly appropriate since it’s subject matter is women in prison – “equality does not mean treating everyone the same”. Not in some people’s opinion, anyway.
The title of this blog is The Illustrated Empathy Gap. What better illustration of the empathy gap do you want?
Conclusions
There is a strong regional variation in KS2 SATS and GCSE attainment, to the advantage of London and the disadvantage of everywhere else.
The regional penalty is greater for boys than girls.
Boys do far worse than girls in English, but are comparable in maths. Based on combined English and maths, the gender gap averaged over the whole of England is greater than the regional penalty averaged over the whole of England.
In GCSE English, the gender gap is far worse than the regional attainment gap – 3 or 4 times greater based on averages over England.
The gender gap in educational attainment is therefore more significant than the regional attainment gap. But the Children’s Commissioner’s report, Growing Up North, ignores the gender gap.
The implication of the report is that male educational disadvantage does not matter.
**********************
[Biographical aside: Anne Longfield, OBE, was formerly CEO of the charity 4Children. I quote from the Wikipedia article on 4Children as it stood on 27/3/18: “4Children began a period of rapid corporate growth under its Chief Executive Anne Longfield. However, this was not matched by growing revenues and the charity ran into financial trouble. It ceased operations and entered administration on 1 September 2016. Before its financial difficulties were publicly known, Longfield was appointed Children’s Commissioner for England.” And from the Wikipedia entry on Anne Longfield, this, “In 2015, shortly after starting her new role as children’s Commissioner, Longfield was criticised for removing her Deputy, Sue Berelowitz, with an enhanced severance package, and then immediately hiring her back as a consultant. It transpired that this had taken place without securing the required approval from government ministers and was therefore an abuse of her powers. The arrangement was subsequently cancelled as a result of media attention and the organisation ordered to repay to HM Treasury £10,000 of misused public funds.”].
Source
No comments:
Post a Comment